


Australia’s cultural diversity deepening and widening – Census data finds
A new swathe of data from the 2016 Census has produced an updated snapshot of Australia’s changing cultural diversity.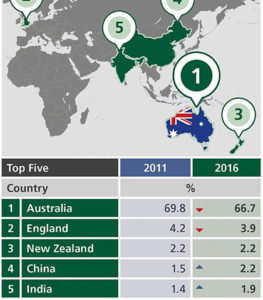
The data, released this week by the Australian Bureau of Statistics (ABS), shows Australia growing ever more diverse, while also showing another rise in the representation of cultures from Asia among Australia’s population.
The ABS defines cultural diversity as relating to a person’s country of birth, their ancestry, the country of birth of their parents, what languages they speak, whether they are of Aboriginal or Torres Strait Islander descent, and their religious affiliation.
The Census data highlights changes in all of these characteristics adding to the rich cultural diversity of Australian society.
It shows that in 2016 two thirds (67 per cent) of the Australian population were born in Australia. And of the 6,163,667 overseas-born persons, nearly one in five (18 per cent) had arrived since the start of 2012.
While England and New Zealand were still the next most common countries of birth after Australia, the proportion of those born overseas who were born in China and India has increased since 2011 from 6.0 per cent to 8.3 per cent, and 5.6 per cent to 7.4 per cent respectively.
The Philippines has swapped places with Italy in the top 10 list, moving from number eight to number six.
Malaysia now appears in the top 10 countries of birth (replacing Scotland) and represents 0.6 per cent of the Australian population.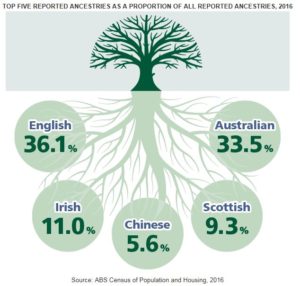
The ABS defines ancestry as an indication of the cultural group that a person most closely identifies with.
Over 300 ancestries were separately identified in the 2016 Census. The most commonly reported ancestries were English (36 per cent) and Australian (34 per cent).
A further six of the leading ten ancestries reflected a European heritage – including Irish, Scottish, Greek and Italian. The two remaining ancestries in the top 10 were Chinese (5.6 per cent) and Indian (4.6 per cent).
In 2016, there were over three hundred separately identified languages spoken in Australian homes. More than one-fifth (21 per cent) of Australians spoke a language other than English at home.
The Aboriginal and Torres Strait Islander population has increased since 2011 from 2.5 per cent to 2.8 per cent of the Australian population with indigenous people now numbering 649,171.
In 2016, Christianity was the main religion reported in Australia with 52 per cent of the population naming it as their faith.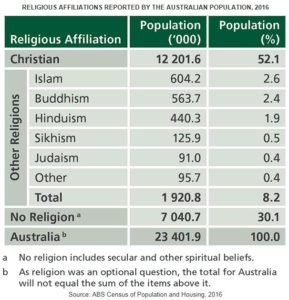
While the Islamic population made up only 2.6 per cent of the total population, it was the second largest religion reported in the 2016 Census after Christianity. Islam was closely followed by Buddhism (2.4 per cent).
The ‘No Religion’ count increased to almost a third of the Australian population between 2011 and 2016 from 22 per cent to 30 per cent.
In 2016, almost half (49 per cent) of Australians had either been born overseas (first generation Australian) or one or both parents had been born overseas (second generation Australian).
For Australia’s overseas-born population, New South Wales was still the most popular state or territory to live in 2016 with 2,072,454 people or 34 per cent of the overseas-born population.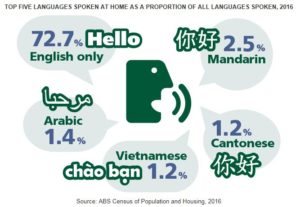
Victoria was home to 1,680, 256 overseas-born Australians or 27.3 per cent of the overseas-born population.
Queensland housed 16.5 per cent of the overseas-born population, WA 12.9 per cent, SA 6.2 per cent, ACT 1.7 per cent, Tasmania 1 per cent and the Northern Territory just .7 per cent.
In 2016, 83 per cent of the overseas-born population lived in a capital city compared with 61 percent of people born in Australia. Sydney had the largest overseas-born population.
Laurie Nowell
AMES Australia Senior Journalist