New map shows settlement trends of refugees in the US
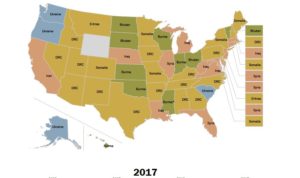
 A new interactive map gives a fascinating insight into how the source of refugees to the US has shifted dramatically over the past 15 years.
As the Trump administration moves to cut refugee numbers settling in the US, the map – produced by the Washington-based Pew Research Center – shows that America’s refugee intake peaked at 84,994 in the 2016 fiscal year.
The map shows that in 2002, the US took in 27,110, refugees rising to 53,806 in 2005 and 60,191 in 2008.
In 2010, the US took in 73,000 refugees and the numbers rose steadily until last year’s peak intake. This year, however the numbers have fallen to 53,000 with President Trump vowing to reduce that ever further to 45,000.
The map also shows the top countries of origin for refugees in each US state from 2002 to 2017 and reveals that while the largest refugee groups in most states currently come from Africa, the Middle East, and South East Asia, most refugees arriving in the early 2000s were from Eastern Europe.
In 2002, the largest refugee group in most states was either from Serbia, Bosnia and Herzegovina, or Ukraine. Conflicts in the Balkans were likely the main contributors to this influx.
The presence of large groups of eastern European refugees continued into the mid-2000s, when refugees from Africa, Myanmar, and the Middle East overtook them as the largest refugee groups in most states.
Burmese refugees continued to be the most prevalent group in most states until the 2010s, when Middle Eastern and African refugees, particularly from Iraq, again began to arrive in large numbers.
Although Syrian and Iraqi refugees attract most publicity in recent discussions about refugee resettlement, in 2017, the largest groups of refugees in most states don’t come from these countries. Most hail from sub-Saharan Africa.
The map shows other fascinating trends.
In almost all of the years logged, Cuban refugees have been the largest resettled group in Florida.
Also, since 2008, in several states the largest group has been refugees from Bhutan.
In California, which takes more refugees than any other state, the early 2000s saw Ukrainians as the largest group of settling refugees. In 2004 and 2005, Laotians were the largest group and Iranians in 2006 – 08. Between 2009 and 2014, Iraqis were the largest groups and Iranians since then.
See the map here: http://www.pewglobal.org/interactives/where-have-refugees-settled-in-the-u-s/
Laurie Nowell
AMES Australia Senior Journalist


