


A visual take on global population
Australia heads the list of the most populous countries in Oceania but the region itself is small fry when it comes to hosting the bulk of the planet’s population.
So, where do most people live across the globe?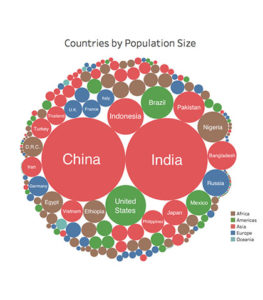
It’s a simple question, but it can be difficult to drill down into the detail to get an accurate sense of the answer by looking solely at lengthy tables of population data.
With almost 200 countries spread across the planet and with populations ranging from near 1.4 billion as with China or India, to nations a tiny fraction of that size, how do we interpret all this?
A new data visualization graphic produced by PopulationPyramid.net, is a resource for data on global population numbers.
It allows you to see the location of the world’s 7.5 billion people by resizing countries based on their populations and then organise them by region.
This simple application of data visualization makes it more intuitive to comprehend where people live around the globe, as well as how different countries compare in size.
The first thing you might notice on the graphic is the relative size of regions, with Asia taking up a whopping 60 per cent of the visual space with 4.5 billion people.
Second is Africa with 16 per cent of visual space and 1.2 billion people, followed by Europe with 10 per cent of visual space and 729 million people.
Next is North America with 7 per cent of visual space and 534 million people followed by South America with 6 per cent and 424 million people.
Central America and Oceania are sixth and seventh each with one per cent of visual space and 47 million and 42 million people respectively.
About 75 per cent of people reside in Asia or Africa while the regions of Europe, North America, South America, and Oceania just total together to 25 per cent of the mix.
But there are some countries that are clear standouts on the data visualization.
For instance, China and India combined are home to 2.7 billion people, accounting for 36 per cent of the total global population.
The United States is third with 326.5 million people, or 4.3 per cent of global population, and Indonesia fourth with 263.5 million people, or 3.5 per cent of global population.
Brazil is fifth with 211.2 million people or 2.8 per cent of the world’s people and Pakistan sixth with 196.7 million people, or 2.6 per cent of global population.
Seventh is Nigeria with 191.8 million people, or 2.6 per cent of global population and eighth is Bangladesh with 164.8 million people, or 2.2 per cent.
Russia comes ninth in the population stakes with 143.3 million people, or 1.9 per cent of global population and the top ten is rounded out by Mexico with 130.2 million people or 1.7 per cent of humanity.
These top ten most populous countries account for 4.358 billion people, or 58 per cent of the world’s population.
The United States, Indonesia, Brazil, and Pakistan rank between number 3 and number 6, and have about a billion people between them.
Nigeria, which is number 7 on the list, has the world’s fastest growing megacity within its borders. Bangladesh is also an interesting entry since it is one of the densest populations globally, with 1,138.9 people per square kilometre of land.
See the graphic here: https://www.populationpyramid.net/population-size-per-country/2017/
Laurie Nowell
AMES Australia Senior Journalist