Census delves into Australia’s diversity
Point Cook, in Melbourne’s western suburbs, is arguably the nation’s most multicultural community with residents born in 140 different countries.
This is one of the fascinating results of the recent 2021 Australian Census’ deeper dive into cultural diversity.
For the first time, the census asked questions about parents and ancestry, languages and religion – and not just place of birth.
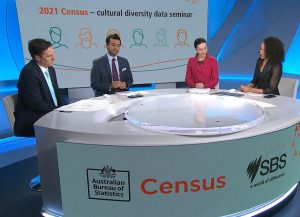
The results of this more nuanced investigation of diversity in Australia were revealed in an Australian Bureau of Statistics (ABS) seminar delivered by ABS Census Division General Manager Duncan Young.
The seminar heard the proportion of overseas born and second generation migrants in Australia have steadily increased since the end of World War II, as counted in the 1947 Census.
After WWII the proportion of overseas born populations dropped to 10 per cent sparking the federal government’s ‘populate or perish’ policy to boost the population, Mr Young said.
The scheme operated until 1982 and focused on Britain and New Zealand but also continental Europe.
“The overseas born population was 20 per cent in 1971 and 28 per cent last year,” Mr Young said.
“In the past ten years 2.3 million people arrived in Australia in the past ten years from 200 countries.
“The top four origin countries for migrants are now India, China, England and New Zealand. And in the past ten years, three quarters have come from Asia,” he said.
The seminar focused on three separate waves of immigration.
Immediately after World War II, 250,000 Italian migrants arrived in Australia but this started to decline from 1971, the seminar heard.
 But now 1.1 million Australians have Italian ancestry; only two cities in Italy – Rome and Milan – have populations greater than a million people.
And, significantly, 460,000 of this group had both parents born in Australia.
And the census found later generations of Italian ancestry were four times more likely to have a university degree that people born in Italy.
The seminar also looked at the recent wave of migration from India.
“Indians are now the largest new migrant group and have increased 50 per cent since 2016,” Mr Young said.
The census showed there are now 670,000 Australians born in India, 40 per cent of them living in Melbourne and 30 per cent in NSW.
It also revealed a plethora of languages spoken at home by Indian Australians with a quarter speaking Punjabi and a third Hindi.
Mr Young said Australia’s Indian community was young and of working age and that the census showed 96 per cent spoke English well.
He said we were yet to see growth in numbers of second or third generation Indian Australians.
The census revealed there are 240,000 second generation Indian Australians; 75 per cent of them have both parents born in India and a similar proportion under 15 years.
There are only 13,000 third generation Indian Australians.
The third wave of migration analysed by the seminar was people from Nepal.
The census shows the Nepali community in Australia doubled between 2016 and 2021.
“There were just 2,500 Nepalese in Australia in the year 2000. In 2006 migration from Nepal began to grow,” Mr Young said.
“Over the next five years, 20,000 more Nepalese came and in each of 2017, 2018 and 2019 another 20,000 came,” he said.
The census shows Australia’s Nepali community has grown from 2,500 to 125,000 in just two decades, with more than half living in NSW.
It shows 97 per cent of Nepali Australians speak English well and 85 per cent are aged 20 to 39 years.
“Cultural diversity in Australia has grown over 75 years with each generation embedding new dimensions to our cultural landscape,” Mr Young said.
“Australians now come from more than 200 countries and 300 ancestries,” he said.
“It is the suite of cultural diversity questions in the census, such as ancestry, country of birth, English proficiency, languages spoken, citizenship status, year of arrival and religious affiliation, which allows us to better understand the increasing complexity and growing cultural diversity in Australia.
“The ancestry variables in the census provide a self-assessed measure of ethnicity and cultural background. When used alongside the country of birth of individuals and their parents, Census data provides a good indication of the ethnic background of all Australians,” Mr Young said.
In the first census in 1911, the proportion of Australians who were born overseas was 18 per cent. In 2021, more than seven million people in Australia were born overseas, this is almost 30 per cent of the population.
It is an increase from 6.1 million, or 26 per cent, in 2016. Over a million people arrived in Australia since the 2016 Census and of these 230,000 are from India, 137,000 are from China and 71,000 are from Nepal.
Most of Australia’s population are descendants of migrants and as a result, the most common ancestries align with the most common countries of birth of the population over time.
In 2021, Australia’s top five ancestries largely reflected waves of British and European migration and were the same top five as reported in 2016.
Shared language is a component of understanding ethnicity. In 2021, 5.6 million people or 22 per cent, reported using a language other than English at home. This was an increase from 4.8 million people or 20.6 per cent in 2016.
For people who used another language at home, the census asked how well they spoke English. In 2021, 3.4 per cent of the population spoke English not well or not at all.
See the full analysis: https://www.abs.gov.au/articles/cultural-diversity-australia


