Demographic shifts could determine US election, Pew analysis
With the US presidential election just weeks away, a new analysis by the Pew Research Center has unearthed some interesting demographic shifts in the American electorate.
The analysis has found Hispanic voters now make up an increasingly larger share of the electorate in every state.
 The increases are particularly large in the Southwestern US, where states like Nevada, California and Texas have seen rapid growth in the Hispanic share of the electorate over an 18-year period.
The data is significant because Hispanic voters are traditionally more likely to vote Democrat.
“These trends are also particularly notable in battleground states – such as Florida and Arizona – that are likely to be crucial in deciding the 2020 election,” the Pew analysis said.
“In Florida, two-in-ten eligible voters in 2018 were Hispanic, nearly double the share in 2000. And in the emerging battleground state of Arizona, Hispanic adults made up about one-quarter of all eligible voters in 2018, up 8 percentage points since 2000,” it said.
 The analysis said that in all 50 states, the share of non-Hispanic White eligible voters had declined between 2000 and 2018, with 10 states experiencing double-digit drops in the share of White eligible voters.
The Washington-based Pew Center says the changing racial and ethnic makeup of the US is reshaping the electorate.
“The ways in which these demographic shifts might shape electoral outcomes are closely linked to the distinct partisan preferences of different racial and ethnic groups,” the analysis says.
Pew Center data collected over twenty years shows that the Democratic Party maintains a wide and long-standing advantage among Black, Hispanic and Asian American registered voters.
Among White voters, the partisan balance has been generally stable over the past decade, with the Republican Party holding a slight advantage.
Black voters have also solidly supported the Democratic contenders, the analysis says.
“Among Asian American registered voters, there are also some differences in party identification by origin group. For instance, Vietnamese Americans are more likely than Asians overall to identify as Republican, while the opposite is true among Indian Americans, who tend to lean more Democratic,” the Pew Center said.
The analysis says that partisan alignment does not tell the whole story when it comes to voting patterns. It says voter turnout rates vary widely across racial and ethnic groups.
“White adults historically have had the highest rate of voter turnout: About two-thirds of eligible White adults (65 per cent) voted in the 2016 election,” the analysis said.
“Black adults have also historically had relatively high rates of voter turnout, though typically slightly lower than Whites. By contrast, Asian and Hispanic adults have had historically lower voter turnout rates, with about half reporting that they voted in 2016,” it said.
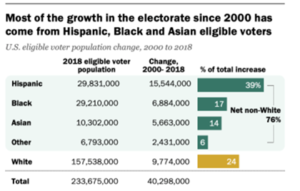
The analysis found the non-White voting population has played a large role in driving growth in the nation’s electorate.
“From 2000 to 2018, the nation’s eligible voter population grew from 193.4 million to 233.7 million – an increase of 40.3 million. Voters who are Hispanic, Black, Asian or another race or ethnicity accounted for more than three-quarters (76%) of this growth,” the analysis said.
“The substantial percentage point increase of voters who are not White as a share of the country’s overall electorate was largely driven by second-generation Americans – the US-born children of immigrants – coming of age, as well as naturalized immigrants and becoming eligible to vote,” it said.
“The increase has been steady over the past 18 years – from 2000 to 2010, their share rose by 4 percentage points (from 24 per cent to 28 per cent), while from 2010 to 2018, their share further grew by 5 points (up from 28 per cent to 33 per cent).


