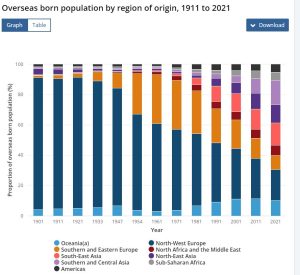
Historical population data shows Australia’s increasing diversity
Migrants in Australia have never been a more diverse bunch, with the spread of places where they come from now broader than ever before.
 This is the finding of a new snapshot of Australian Bureau of Statistics (ABS) historical data.
The ABS has charted Australia’s overseas-born population since federation in 1901.
It found that in 1901 more than 90 per cent of the migrant population, or 741,000 people, were from North-West Europe Just 33,000 were from North-East Asia, 12,600 were from Southern and Eastern Europe and 12,500 were from the Americas.
In 1954, the number of migrants from North-East Europe had grown to 815,000 but had shrunk as a proportion of the migrant population to about 60 per cent.
Migrants from Southern Europe numbered 346,000 or about 34 per cent. Migrants from Oceania numbered around 50,000, or about five per cent of the migrant population.
By 1981, migrants from North-West Europe numbered 1.4 million, or around 44 per cent of the migrant population. Migrants from Southern Europe numbered 840,000, or about 30 per cent of the migrant population.
People from Oceania numbered 200,000, or about seven per cent of the migrant population. Almost 375,000, or about eight per cent of migrants, were from South-East Asia.
Seventy-four thousand people were from North Africa and the Middle East. More than 90,000 were from the Americas and 58,000 were from sub-Saharan Africa.
In 2021, there were 1.53 million migrants from North-West Europe – still the largest proportion at about 13 per cent. But 1.2 million people, or about 11 per cent of all migrants were from Southern and Central Asia.
More than 1.1 million people, or about eight per cent of all migrants, were from South-East Asia. About 904,000, or about six per cent, were from North-East Asia, 770,000 were from Oceania and 709,000 were from Southern or Eastern Europe.
Migrants from North Africa and the Middle East numbered 495,000, or about 3.5 per cent of migrants, while those from sub-Saharan Africa numbered 406,000 and migrants from the Americas numbered 378,000.
The ABS data also shows yearly migration to Australia has increased over time, albeit at varying rates, whilst migration rates per 1000 usual residents have fluctuated over time.
“Yearly net overseas migration has increased from 76,000 in 1972 to 241,000 in 2019. The rate of yearly net overseas migration has changed from 5.7 migrants per 1,000 usual residents in 1972 to 9.5 in 2019. The highest rate since 1972 was 13.8 in 2009. The lowest was -3.3 in 2021,” the report said.
Around 23,000 short-term international visitors travelled to Australia in 1925. This increased to 9.5 million in 2019.
The yearly rate of international short-term visitors increased from 3.9 to 371 per 1,000 usual residents between 1925 and 2019.
Meanwhile, Australia’s population has increased from 3.8 million in 1901 to 25.7 million in 2021.
The urban population has increased from 58 per cent of the total population in 1911 to 90 per cent in 2021.
Fertility has decreased from 3.1 births per woman in 1921 to 1.7 in 2021 and life expectancy at birth has increased by 26 years since the early 1900s, the ABS report said.
“Since 1901, Australia’s population has substantially increased both nationally and at the state and territory level. Australia’s 2021 population is 6.8 times larger than in 1901, increasing from 3.8 to 25.7 million,” it said.
The national population has grown every year, excluding WWI, since 1901. The highest net population growth occurred in 2009.
Excluding 2021, population growth from migration has exceeded natural increase since 2006.
Australia’s population has aged considerably, but at varying rates, since Federation.
Australia’s median age has increased from 22.5 in 1901 to 38.4 in 2021. The population aged between 1901 and 1944, and 1971 and 2021. And, nationally, females have outnumbered males since 1978.
See the ABS data here: Historical population, 2021 | Australian Bureau of Statistics (abs.gov.au)


