


Melbourne’s changing multicultural make-up
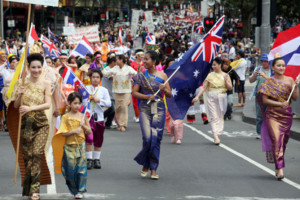
AAP Image/David Crosling
The ethnic make-up of Melbourne’s suburbs has changed dramatically over the past forty years, according to a new analysis of Census data.
In the decades after WWII it was easy to stereotype suburbs by their ethnic make-up; the Italians went to Carlton, the Greeks found Richmond, the Lebanese settled in Coburg and the Vietnamese made Footscray home.
But now, the picture is not so simple.
A new interactive map created by data-visualisation company Small Multiples based on data from the 2011 census illustrates how migrants make up the fabric of multicultural Melbourne.
The map works like a Google map, so you can focus in on any section of Victoria. The first map shows migrants from England, while the second one excludes English migrants and highlights the diversity of migrants from other countries.
The maps show Vietnamese migrants still largely occupy Melbourne’s west: Footscray, Maidstone, Maribyrnong, Braybrook, Sunshine North, Sunshine West, St Albans, Albanvale and Deer Park.
However, there is also a pocket of Vietnamese migrants in the city’s south-east, in the suburbs of Springvale and Keysborough.
One in every five residents of Springvale (22 per cent) and Springvale South (19 per cent) in 2011 was born in Vietnam, according to the Australian Bureau of Statistics.
Meanwhile, Chinese migrants dominate the east: Doncaster (11 per cent), Box Hill (20 per cent), Clayton (17 per cent).
Italian-born residents still call the city’s northern suburbs home, but not necessarily Carlton.
The dominant migrant nationality in Carlton is now Chinese, with 10 per cent of residents having been born in China. Nine per cent of residents in Carlton were born in Malaysia, while 4 per cent hail from Singapore.
This is probably explained by Carlton’s population of international students – a third of the suburb’s residents were international students at the time of the 2011 census, due to its proximity to the University of Melbourne and RMIT University.
The Italians meanwhile have moved further north to Brunswick and Moonee Ponds, and further west to Hadfield, the map shows.
However, the most concentrated areas of Italian migrants include Keilor Park (15 per cent), Keilor North (13 per cent) and Avondale Heights (12 per cent).
In 2011, 67,000 residents of Melbourne were born in Italy and 48,000 were born in Greece.
Greek-born migrants were most prominently found in Clarinda, Hughesdale, Clayton South, Oakleigh, and Oakleigh South, all of which are located in the city’s south-east.
Dandenong South has a relatively large population of Afghani-born migrants.
In Springvale South, one in eight residents were born in Cambodia.
Among the top ranking countries of birth among Melbourne residents are India and Sri Lanka.
Sri Lankan migrants have settled largely in Melbourne’s south-east, including Dandenong North, Rowville, Lysterfield, Noble Park and Endeavour Hills, but there is also a pocket in the city’s north in Yuroke, near Sunbury.
Melbourne’s Indian belt stretches south-east from Noble Park to Cranbourne East. Yet, on the opposite side of the bay, Indian migrants have settled in Wyndham Vale, Werribee, Point Cook and Laverton.
They have also settled in small pockets in Essendon, Epping, Heidelberg, Glenroy and Albion.
New Zealanders appear to favour bay-side suburbs, including Port Melbourne, Williamstown, Brighton, Elwood and St Kilda, while South Africans prefer Caulfield North, Caulfield South and Brighton East.
At just over 150,000 people, however, migrants born in the United Kingdom were the largest overseas-born population group in Melbourne, accounting for 4.3 per cent of the city’s total population in 2011.
UK-born migrants are most concentrated along the Mornington Peninsula.
In Bangholme, one in five residents was born in the UK.
Victoria’s population grew by 2 per cent or 110,500 people to the year ending September 2013, ABS data shows.
Overseas migration made up the bulk of the new residents, with 62,300, followed by births 41,300 and interstate arrivals 6900, for a population of 5,768,000.
The state’s population is expected to grow from 5.6 million to 7.3 million over the next 20 years, an average annual growth rate of 1.3 per cent.
Sheree Peterson
AMES Staff Writer