


US Immigration – by the numbers
As US President Donald Trump set out to remake his nation’s migration regime by slashing overall numbers and particularly low-skilled workers, a new snapshot of migrants in the US has been published.
The Washington-based Pew Research Centre has completed a statistical portrait of the US’ foreign born population which takes in demographic trends going back to the 1960s.
The Pew Centre found the US has more immigrants than any other country in the world. Today, more than 40 million people living in the U.S. were born in another country, accounting for about one-fifth of the world’s migrants in 2015.
The population of immigrants is also very diverse, with just about every country in the world represented among U.S. immigrants, the Pew Centre found.
 The US foreign-born population reached a record 43.2 million in 2015. Since 1965, when US immigration laws replaced a national quota system, the number of immigrants living in the US has more than quadrupled.
Immigrants today account for 13.4 per cent of the US population, nearly triple the share (4.7 per cent) in 1970. However, today’s immigrant share remains below the record 14.8 per cent share in 1890, when 9.2 million immigrants lived in the US.
Most immigrants (76 per cent) are in the country legally, while a quarter are unauthorized. In 2015, 44 per cent were naturalized US citizens, the snapshot found.
Some 27 per cent of immigrants were permanent residents and 5 per cent were temporary residents. Another 24 per cent of all immigrants were unauthorized immigrants in 2015.
From 1990 to 2007, the unauthorized immigrant population tripled in size – from 3.5 million to a record high of 12.2 million. During the Great Recession, the number declined by a million and since then has leveled off.
In 2015, there were 11 million unauthorized immigrants in the U.S., accounting for 3.4 per cent of the nation’s population.
The decline in the unauthorized immigrant population is due largely to a fall in the number from Mexico – the single largest group of unauthorized immigrants in the US.
Between 2007 and 2015, this group decreased by more than 1 million. Meanwhile, this decline was partly offset by a rise in the number from Central America, Asia and sub-Saharan Africa.
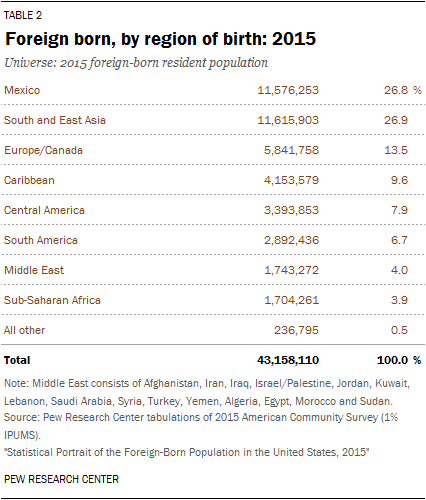
Mexico is the top origin country of the US immigrant population. In 2015, 11.6 million immigrants living in the US were from there, accounting for 27 per cent of all US immigrants.
The next largest origin groups were those from China (6 per cent), India (6 per cent), the Philippines (5 per cent) and El Salvador (3 per cent).
By region of birth, immigrants from South and East Asia combined accounted for 27 per cent of all immigrants, a share equal to that of Mexico. Other regions make up smaller shares: Europe/Canada (14 per cent), the Caribbean (10 per cent), Central America (8 per cent), South America (7 per cent), the Middle East (4 per cent) and sub-Saharan Africa (4 per cent).
About one million immigrants arrive in the US each year. In 2015, the top country of origin for new immigrants coming into the US was India, with 110,000 people, followed by Mexico (109,000), China (90,000) and Canada (35,000).
By race and ethnicity, more Asian immigrants than Hispanic immigrants have arrived in the US each year since 2010.
Immigration from Latin America slowed following the Great Recession, particularly from Mexico, which has seen net losses in US immigration over the past few years.
Asians are projected to become the largest immigrant group in the US by 2055, surpassing Hispanics.
In 2065, Pew Research Center estimates indicate that Asians will make up some 38 per cent of all immigrants, Hispanics 31 per cent, whites 20 per cent and blacks 9 per cent.
But new immigrant arrivals have fallen, mainly due to a decrease in the number of unauthorised immigrants coming to the US.
The fall in the growth of the unauthorized immigrant population can partly be attributed to more Mexican immigrants leaving the US than coming in.
Looking forward, immigrants and their descendants are projected to account for 88 per cent of US population growth through 2065, assuming current immigration trends continue.
In addition to new arrivals, US births to immigrant parents will be important to future US growth.
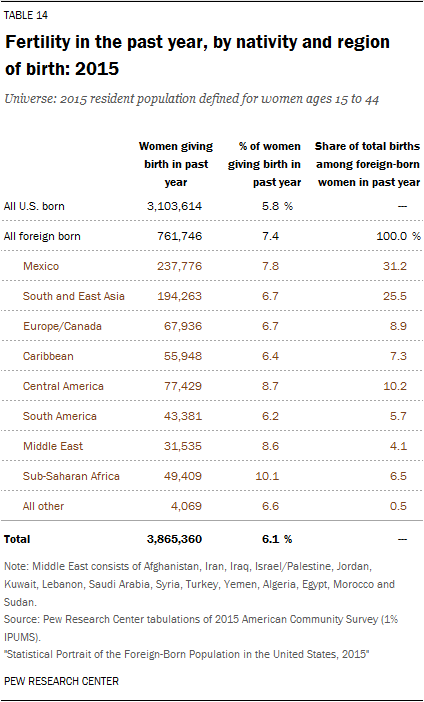
In 2015, the percentage of women giving birth in the past year was higher among immigrants (7.4 per cent) than among the U.S. born (5.8 per cent). While US-born women gave birth to over 3 million children that year, immigrant women gave birth to over 700,000.
In 2016, a total of 84,995 refugees were resettled in the US. The largest origin group of refugees was the Democratic Republic of the Congo, followed by Syria, Burma (Myanmar), Iraq and Somalia.
Among all refugees admitted in that fiscal year, 38,901 are Muslims (46 per cent) and 37,521 are Christians (44 per cent). California, Texas and New York resettled nearly a quarter of all refugees admitted in fiscal 2016.
Roughly half (46 per cent) of the nation’s 43.2 million immigrants live in just three states: California (25 per cent), Texas (11 per cent) and New York (10 per cent).
California had the largest immigrant population of any state in 2015, at 10.7 million. Texas and New York had about 4.5 million immigrants each.
In 2015, most immigrants lived in just 20 major metropolitan areas, with the largest populations in New York, Los Angeles and Miami.
These top 20 metro areas were home to 27.9 million immigrants, or 65 per cent of the nation’s total. Most of the nation’s unauthorized immigrant population lived in these top metro areas as well.
Laurie Nowell
AMES Australia Senior Journalist
